
|
|
|
Assay for Multidrug Resistance Transporters
Because many drugs are MDR substrates, the interaction of compounds with MDR plays an important part in regulating drug action. In liver, kidney and intestines, the transporter excretes compounds from the body. In the brain, MDR is expressed on the apical surface of brain capillaries, where it transports compounds into the blood (reviewed in 2, 3). This transport forms an important part of the blood-brain barrier (BBB) because it prevents compounds that are MDR substrates from accumulating in the central nervous system (CNS). In some cases, this is an undesirable property because it prevents compounds from acting in the CNS. In other cases, this property prevents undesirable effects in the CNS, allowing a compound to act only in the periphery. For example, loperamide is a widely-used opioid antidiarrheal drug that is an MDR substrate. In wild-type animals, effects characteristic of CNS opiate action are not observed at any dose. In contrast, in mice with a knockout of the MDR gene, the concentration in the CNS is elevated 13 fold compared to wild type and CNS opiate effects were seen at low doses (4).
 MDR also plays an important role in cancer chemotherapy. Many cancer chemotherapeutic agents,
(e.g. daunorubicin and tamoxifen), are transport substrates. Treatment with chemotherapeutic
agents kills most tumor cells, but also selects for cells that overexpress the MDR protein.
These overexpressing tumor cells are resistant to the agents used to treat to the patient and to
other drugs that are MDR substrates as well. This drug resistance complicates chemotherapy aimed
at these residual tumor cells. As a consequence, compounds that compete for MDR have the potential
to potentiate the action of drugs that are MDR substrates and that work at intracellular targets.
Significant effort has been aimed at discovering and developing compounds of this type, which are
termed MDR reversers (MDRR). In fact, some of these MDRR agents are in clinical trials (reviewed
in 1).
MDR also plays an important role in cancer chemotherapy. Many cancer chemotherapeutic agents,
(e.g. daunorubicin and tamoxifen), are transport substrates. Treatment with chemotherapeutic
agents kills most tumor cells, but also selects for cells that overexpress the MDR protein.
These overexpressing tumor cells are resistant to the agents used to treat to the patient and to
other drugs that are MDR substrates as well. This drug resistance complicates chemotherapy aimed
at these residual tumor cells. As a consequence, compounds that compete for MDR have the potential
to potentiate the action of drugs that are MDR substrates and that work at intracellular targets.
Significant effort has been aimed at discovering and developing compounds of this type, which are
termed MDR reversers (MDRR). In fact, some of these MDRR agents are in clinical trials (reviewed
in 1).
Assay for MDR Activity
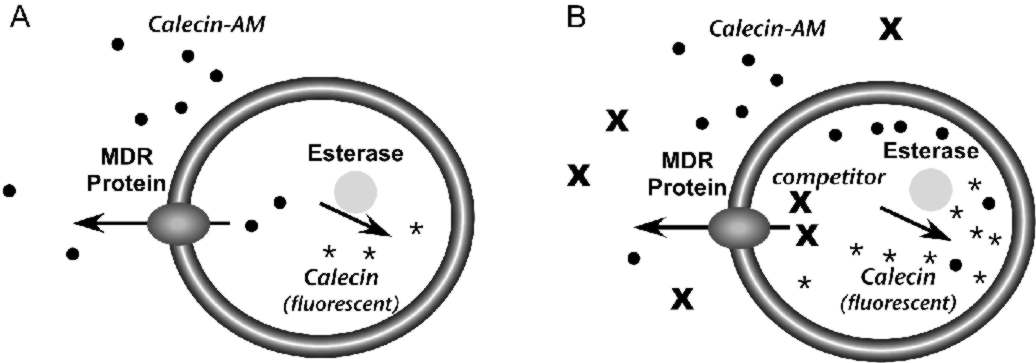
The Psychoactive Drug Screening Program uses a live cell assay to measure the interaction of compounds with the MDR transporter (5). The assay is performed in Caco-2 cells, a cultured line derived from human colonic epithelium that expresses MDR (6). The assay relies on calcein acetoxymethyl ester (calcein-AM), a lipophilic compound that enters cells by passive diffusion across the plasma membrane (Fig. 1). Once inside cells, esterases can hydrolyze calcein-AM to calcein, which is trapped in the cytoplasm because it is negatively charged. Moreover, calcein is highly fluorescent, but calcein-AM is not.The assay is based on the fact that MDR can transport calcein-AM from cells, but not free calcein. In cells that express MDR, calcein-AM that crosses the plasma membrane will be pumped from the cells before it can be converted to calcein and the accumulation of fluorescence will be low (Fig. 1A). Compounds that compete with calcein-AM for MDR will prevent calcein-AM extrusion, resulting in increased conversion to calcein and increased fluorescence (Fig. 1B). Therefore, the effect of a compound on fluorescence accumulation can be used to measure its interaction with the MDR protein
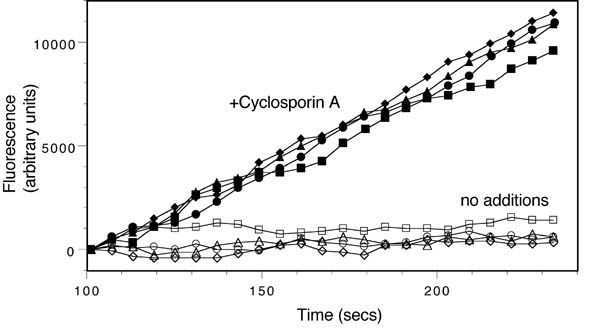
The assay monitors the time-dependent increase in calcein fluorescence in live cells in 96 well plates. This is carried out using a FlexStation II fluorimeter (Molecular Devices). Cells are preincubated with test compounds (50 �M) for 30 min and then the instrument adds calcein-AM to the cells (150 nM final concentration). The instrument monitors fluorescence over a 4 min period and calculates the slope of the fluorescence increase. All compounds are assayed in quadruplicate and each assay contains wells with no test compound and wells with 25 �M cyclosporin A, an efficient MDR inhibitor (Fig. 2). Results for test compounds are calculated from the slope of the fluorescence increase and are normalized so the value from untreated cells is 0% and the value for cyclosporin A is 100%.
This assay has several features that make it ideal for initial screening of compounds for interaction with MDR. Because the assay is carried out in live cells, compounds must diffuse across lipid bilayers to interact with MDR sites on the cytoplasmic face of the protein. This is similar to the situation in vivo, where compounds must diffuse into the cytoplasm where they interact with MDR.
Although this assay is excellent for initial screening, PDSP users should be aware that the assay has some drawbacks. i) The assay does not distinguish between MDR substrates and inhibitors. Both will give similar signals in the assay because they prevent the transport of calcein-AM. ii) Some compounds may give spurious results by inhibiting the esterases that convert calcein-AM to calcein (Fig. 1). iii) Activity depends on the cytoplasmic concentration of the compounds. For a compound that is an MDR substrate, this concentration depends on the rate of diffusion across the plasma membrane and the rate at which MDR pumps the compound from the cells. At steady state, the cytopla smic concentration will be lower than the extracellular concentration, but it cannot be measured easily. Consequently this assay is not the best choice for determining half-maximal concentrations for interacting compounds. An in vitro assay that will provide better quantitative data is currently under development.
References
![]() Mizuno, N., Niwa, T., Yotsumoto, Y., Sugiyama, Y. (2003) Impact of drug transporter studies on drug discovery and development.
Pharmacol Rev 55, 425-461
Mizuno, N., Niwa, T., Yotsumoto, Y., Sugiyama, Y. (2003) Impact of drug transporter studies on drug discovery and development.
Pharmacol Rev 55, 425-461
![]() Demeule, M., Regina, A., Jodoin, J., Laplante, A., Dagenais, C., Berthelet, F., Moghrabi, A.,
Beliveau, R. (2002) Drug transport to the brain: key roles for the efflux pump P-glycoprotein in
the blood-brain barrier.
Vascul Pharmacol 38, 339-348.
Demeule, M., Regina, A., Jodoin, J., Laplante, A., Dagenais, C., Berthelet, F., Moghrabi, A.,
Beliveau, R. (2002) Drug transport to the brain: key roles for the efflux pump P-glycoprotein in
the blood-brain barrier.
Vascul Pharmacol 38, 339-348.
![]() Schinkel, A. H. (1999) P-Glycoprotein, a gatekeeper in the blood-brain barrier.
Adv Drug Deliv Rev 36, 179-194
Schinkel, A. H. (1999) P-Glycoprotein, a gatekeeper in the blood-brain barrier.
Adv Drug Deliv Rev 36, 179-194
![]() Schinkel, A. H., Wagenaar, E., Mol, C. A., van Deemter, L. (1996) P-glycoprotein in the
blood-brain barrier of mice influences the brain penetration and pharmacological activity of
many drugs.
J Clin Invest 97, 2517-2524
Schinkel, A. H., Wagenaar, E., Mol, C. A., van Deemter, L. (1996) P-glycoprotein in the
blood-brain barrier of mice influences the brain penetration and pharmacological activity of
many drugs.
J Clin Invest 97, 2517-2524
![]() Tiberghien, F., Loor, F. (1996) Ranking of P-glycoprotein substrates and inhibitors by a
calcein-AM fluorometry screening assay. Anticancer Drugs 7, 568-578
Tiberghien, F., Loor, F. (1996) Ranking of P-glycoprotein substrates and inhibitors by a
calcein-AM fluorometry screening assay. Anticancer Drugs 7, 568-578
![]() Hamilton, G., Cosentini, E. P., Teleky, B., Koperna, T., Zacheri, J., Riegler, M., Feil, W.,
Schiessel, R., Wenzi, E. (1993) The multidrug-resistance modifiers verapamil, cyclosporine A
and tamoxifen induce an intracellular acidification in colon carcinoma cell lines in vitro.
Anticancer Res 13, 2059-2063
Hamilton, G., Cosentini, E. P., Teleky, B., Koperna, T., Zacheri, J., Riegler, M., Feil, W.,
Schiessel, R., Wenzi, E. (1993) The multidrug-resistance modifiers verapamil, cyclosporine A
and tamoxifen induce an intracellular acidification in colon carcinoma cell lines in vitro.
Anticancer Res 13, 2059-2063
If significant analysis and/or consulting was provided by the NIMH PDSP staff please include the appropriate person(s) as an author.